Sources and Data
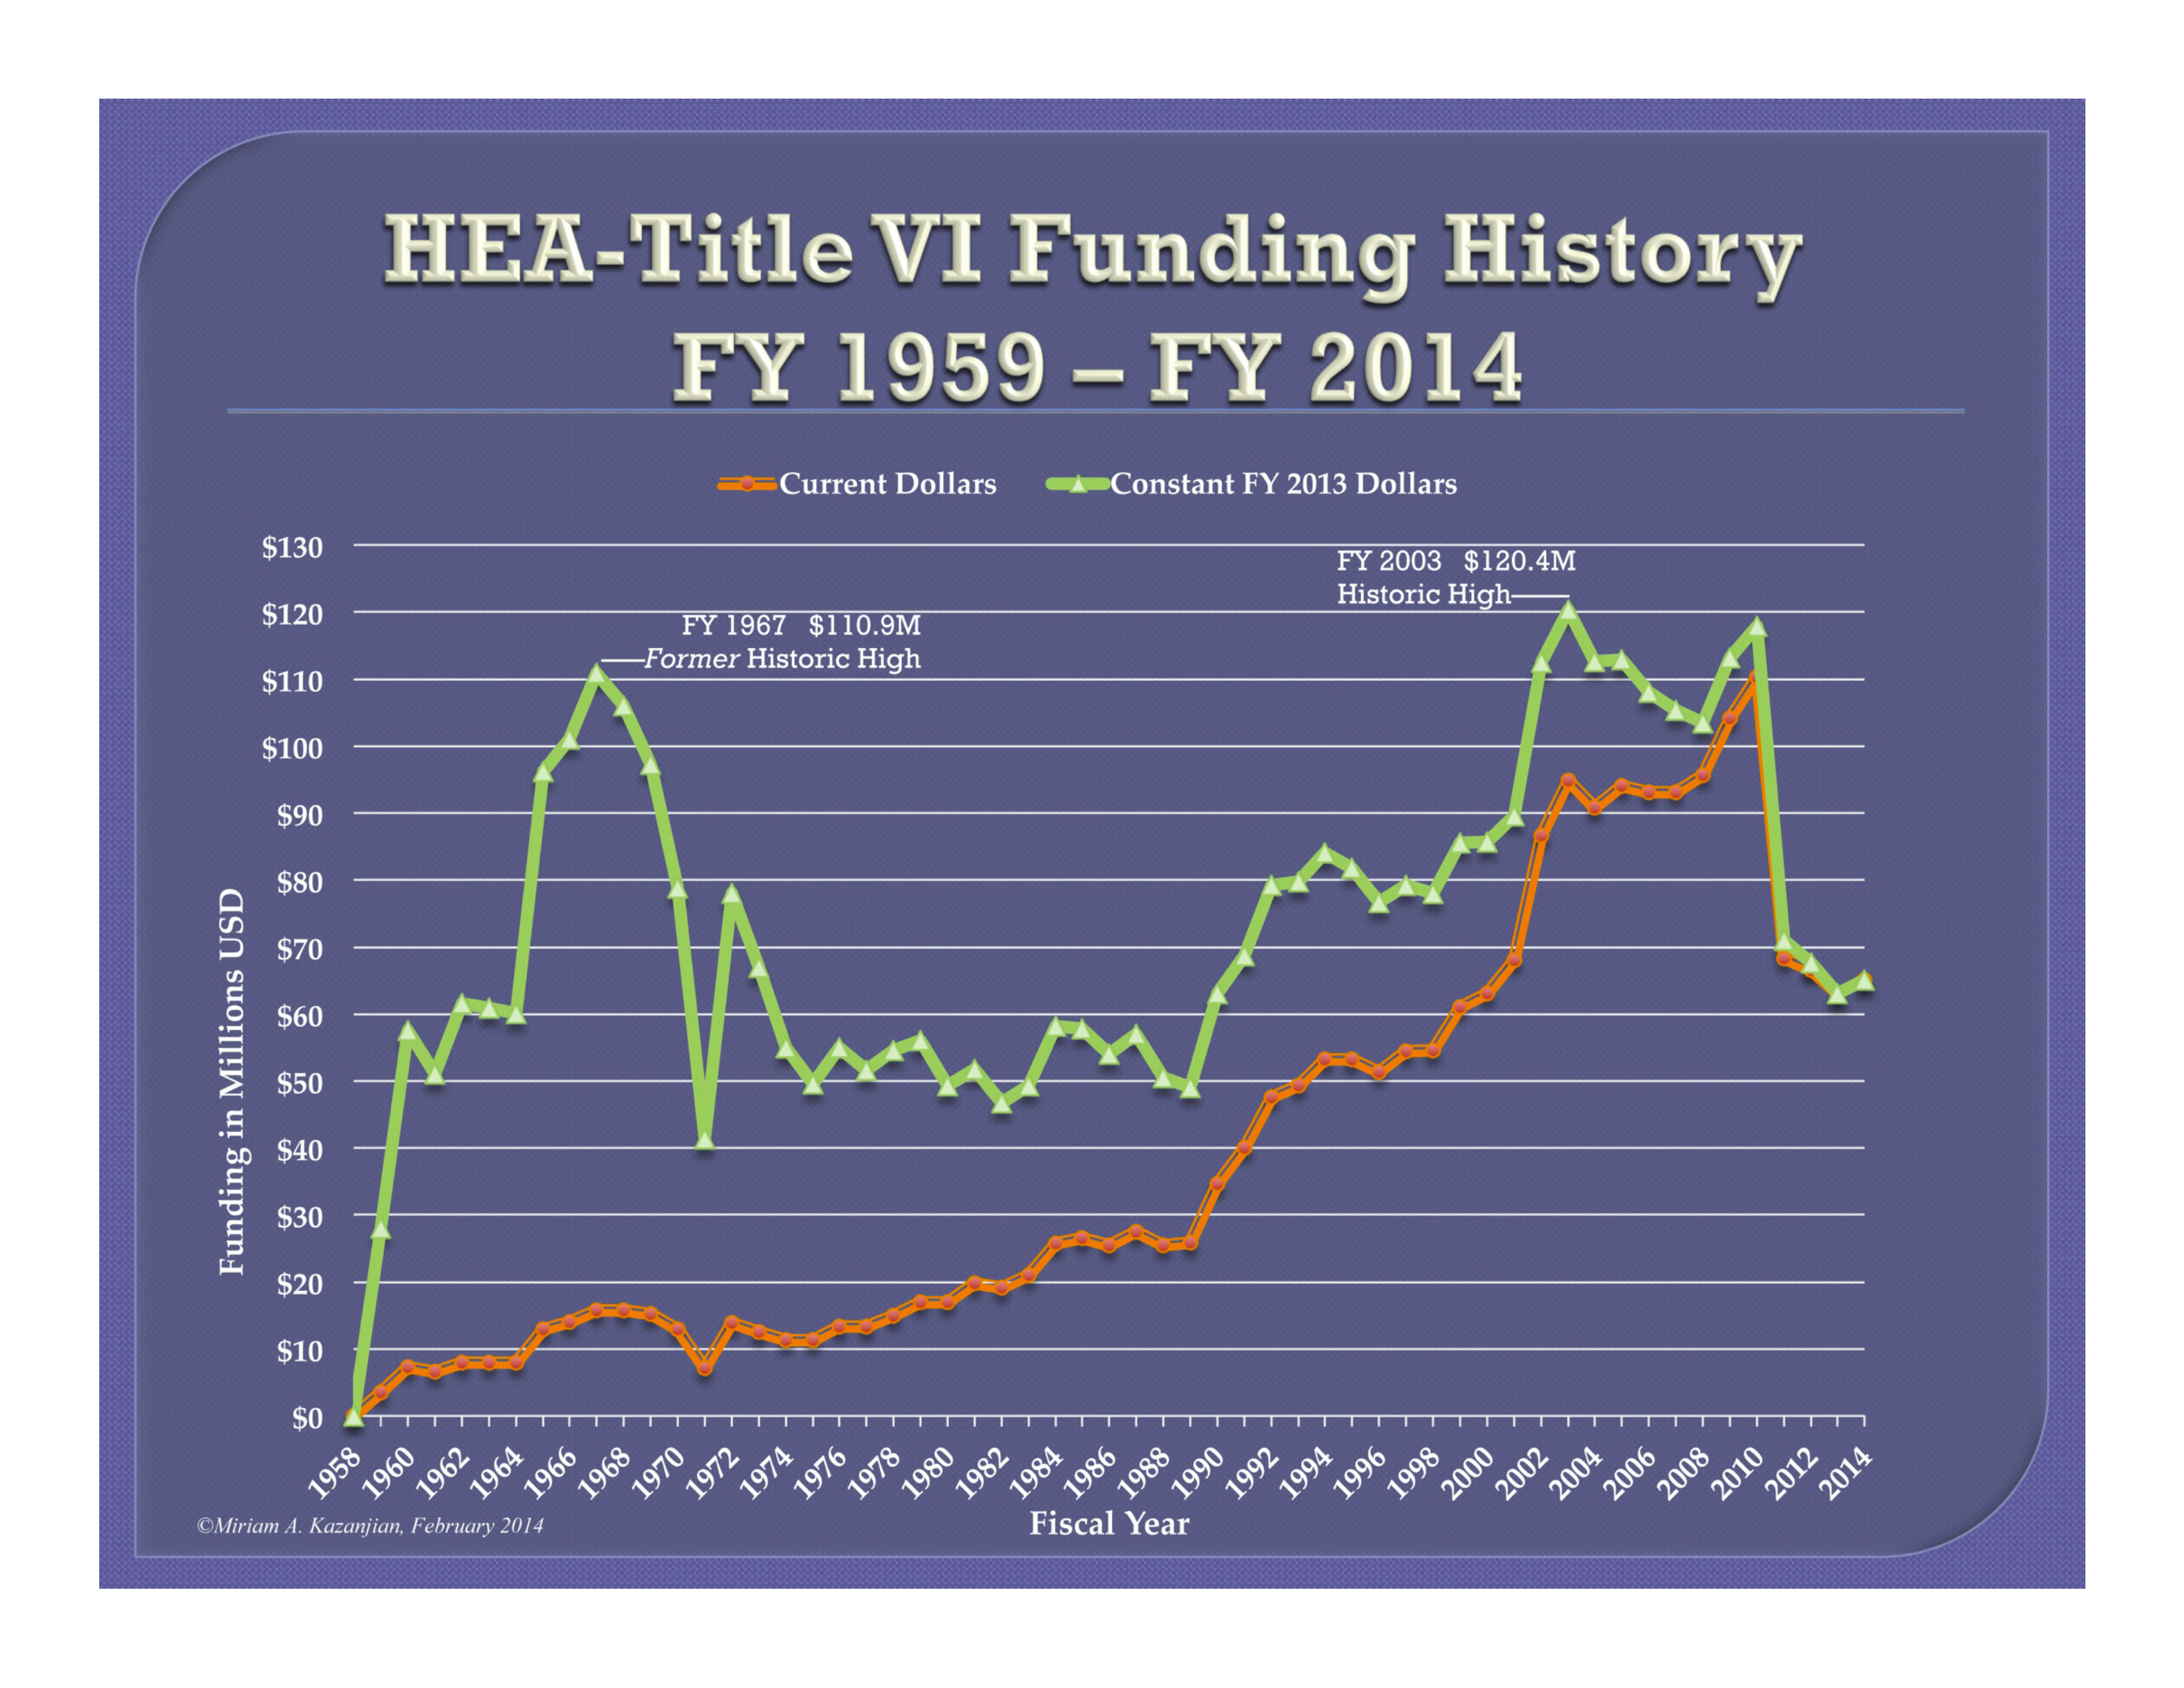
Updated chart from Miriam Kazanjian, Coalition for International Education, February 2014:
Sources and data
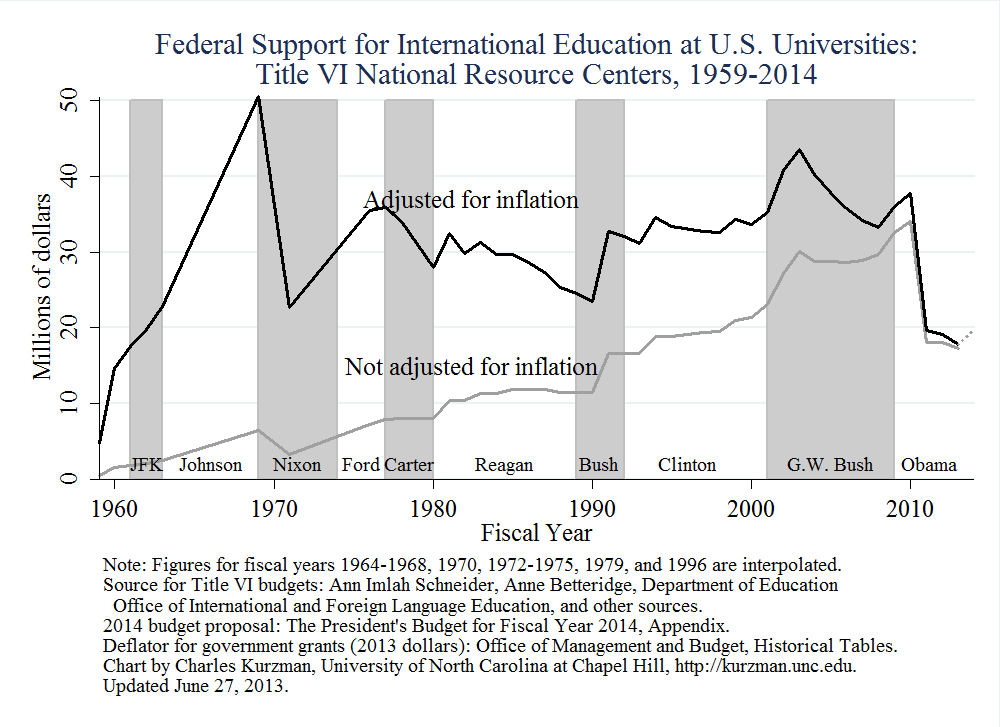
for “Crippling International Education”
By Charles Kurzman
April 26, 2013, updated with more detailed data on June 27, 2013
U.S. Department of Education, Title VI funding for international and area studies centers
(millions of current U.S. dollars)
Fiscal Years 1959-1963
Source: Donald N. Bigelow and Lyman H. Legters, NDEA Language and Area Centers: A Report on the First 5 Years. Washington, DC: U.S. Department of Health, Education, and Welfare, Office of Education, Bulletin 1964, No. 41, OE-56016, pages 23, 26, 28, 30, and 31.
1959: $499,653
1960: $1,575,000
1961: $1,851,007
1962: $2,110,000
1963: $2,520,000
Fiscal Years 1969 and 1971
Source: from Richard D. Lambert, Language and Area Studies Review. Philadelphia, PA: American Academy of Political and Social Sciences, October 1973, p. 309.
1969: $6,380,000
1971: $3,279,000
Fiscal Years 1976-1978
Source: United States, General Accounting Office, Study of Foreign Languages and Related Areas: Federal Support, Administration, Need: Report to the Congress. Washington, DC: General Accounting Office, 1978, pp. 5, 46.
1976: $7,247,620
1977: $7,900,000
1978: $8,000,000
Fiscal Year 1980
Source: Lorraine M. McDonnell, Sue E. Berryman, and Douglas Scott, Federal Support for International Studies: The Role of NDEA Title VI, p. 33. Santa Monica, CA: Rand Corporation, 1981, http://www.rand.org/pubs/reports/2009/R2770.pdf.
1980: $8,000,000
Fiscal Years 1981-1996
Source: Ann Imlah Schneider, Center for International Education, U.S. Department of Education, “Table III: Distribution of Title VI Support to National Resource Centers, 1959-1995, By World Area” (undated photocopy). Thanks also to Anne Betteridge, “Distribution of Title VI Support to National Resource Centers, 1959-2010 (by percentage),” Excel spreadsheet, November 30, 2012.
1959-1972 (total for 14 years): $54,871,000
1973-1980 (total for 8 years): $54,287,000
1981-1982 (total for 2 years): $20,674,000
1983-1984 (total for 2 years): $22,700,000
1985-1987 (total for 3 years): $35,560,000
1988-1990 (total for 3 years): $34,213,000
1991-1993 (total for 3 years): $49,650,000
1994-1995 (total for 2 years): $37,759,000
Fiscal Years 1997-1999
Source: Department of Education, Office of Postsecondary Education, Office of International and Foreign Language Education, “National Resource Center Funding FY 1997-99,” http://www2.ed.gov/programs/iegpsnrc/awards.html, accessed April 26, 2013.
1997: $19,396,997
1998: $19,493,594
1999: $21,000,000
Fiscal Years 2000-2012
Source: Department of Education, Office of Postsecondary Education, Office of International and Foreign Language Education, “National Resource Centers Program, Funding Status,” http://www2.ed.gov/programs/iegpsnrc/funding.html, accessed April 26, 2013.
2000: $21,352,749
2001: $23,020,000
2002: $27,175,000
2003: $30,029,850
2004: $28,714,534
2005: $28,714,534
2006: $28,620,000
2007: $28,849,500
2008: $29,624,152
2009: $32,582,845
2010: $33,989,375
2011: $18,048,762
2012: $18,048,762
Fiscal Year 2013
Source: 4.6% sequester * FY 2012 total of $18,048,762.
2013: $17,255,030
Fiscal Year 2014 (proposed)
Source: The President’s Budget for Fiscal Year 2014, Appendix, Department of Education, p. 338. Washington, DC: The White House, 2013,
http://www.whitehouse.gov/sites/default/files/omb/budget/fy2014/assets/edu.pdf, accessed April 26, 2013.
Note: Budget proposal is for total Title VI funding, not just international and area studies centers,
of $81 million, up from $74 million in FY 2013. Anticipated funding for the centers is estimated to
follow this same ratio: 81/74 * FY 2013 (pre-sequester) total of $18,048,762 million
2014: $19,756,077
Adjustment for inflationSource: White House, Office of Management and Budget, Historical Tables, Table 10.1, “Gross Domestic Product and Deflators Used in the Historical Tables: 1940-2018,” column J, “Other Grants,” http://www.whitehouse.gov/omb/budget/Historicals, accessed April 22, 2013.
Note: Fiscal Year 2005=1.000 is adjusted in the chart so that 2013=1.000.
1959: 0.1407
1960: 0.1420
1961: 0.1394
1962: 0.1405
1963: 0.1455
1964: 0.1483
1965: 0.1525
1966: 0.1488
1967: 0.1515
1968: 0.1570
1969: 0.1663
1970: 0.1777
1971: 0.1903
1972: 0.1986
1973: 0.2036
1974: 0.2237
1975: 0.2477
1976: 0.2691
1977: 0.2907
1978: 0.3098
1979: 0.3381
1980: 0.3769
1981: 0.4199
1982: 0.4564
1983: 0.4798
1984: 0.5053
1985: 0.5258
1986: 0.5455
1987: 0.5722
1988: 0.5930
1989: 0.6139
1990: 0.6412
1991: 0.6667
1992: 0.6821
1993: 0.7024
1994: 0.7215
1995: 0.7466
1996: 0.7683
1997: 0.7810
1998: 0.7888
1999: 0.8064
2000: 0.8359
2001: 0.8622
2002: 0.8789
2003: 0.9089
2004: 0.9421
2005: 1.0000
2006: 1.0558
2007: 1.1139
2008: 1.1767
2009: 1.1930
2010: 1.1878
2011: 1.2158
2012: 1.2458
2013: 1.2797
2014: 1.3187